

What Is a Planogram? How Retail Shelf Planning Works
Walk into a well-organized supermarket, pharmacy, electronics store, or convenience shop and the product placement may look effortless, but much of it is carefully planned. Retailers often use a planogram to determine where products should appear, how much shelf space each item should receive, and how categories should be arranged for shoppers. These visual merchandising plans help stores make better use of limited space while keeping displays consistent across multiple locations. A strong planogram can also support sales, inventory management, product visibility, and a smoother customer journey. As retailers become more data-driven, planograms increasingly combine merchandising knowledge with sales performance, shopper behavior, and inventory information. Understanding how planograms work makes it easier to see why shelf placement plays such an important role in modern retail.
What Is a Planogram?
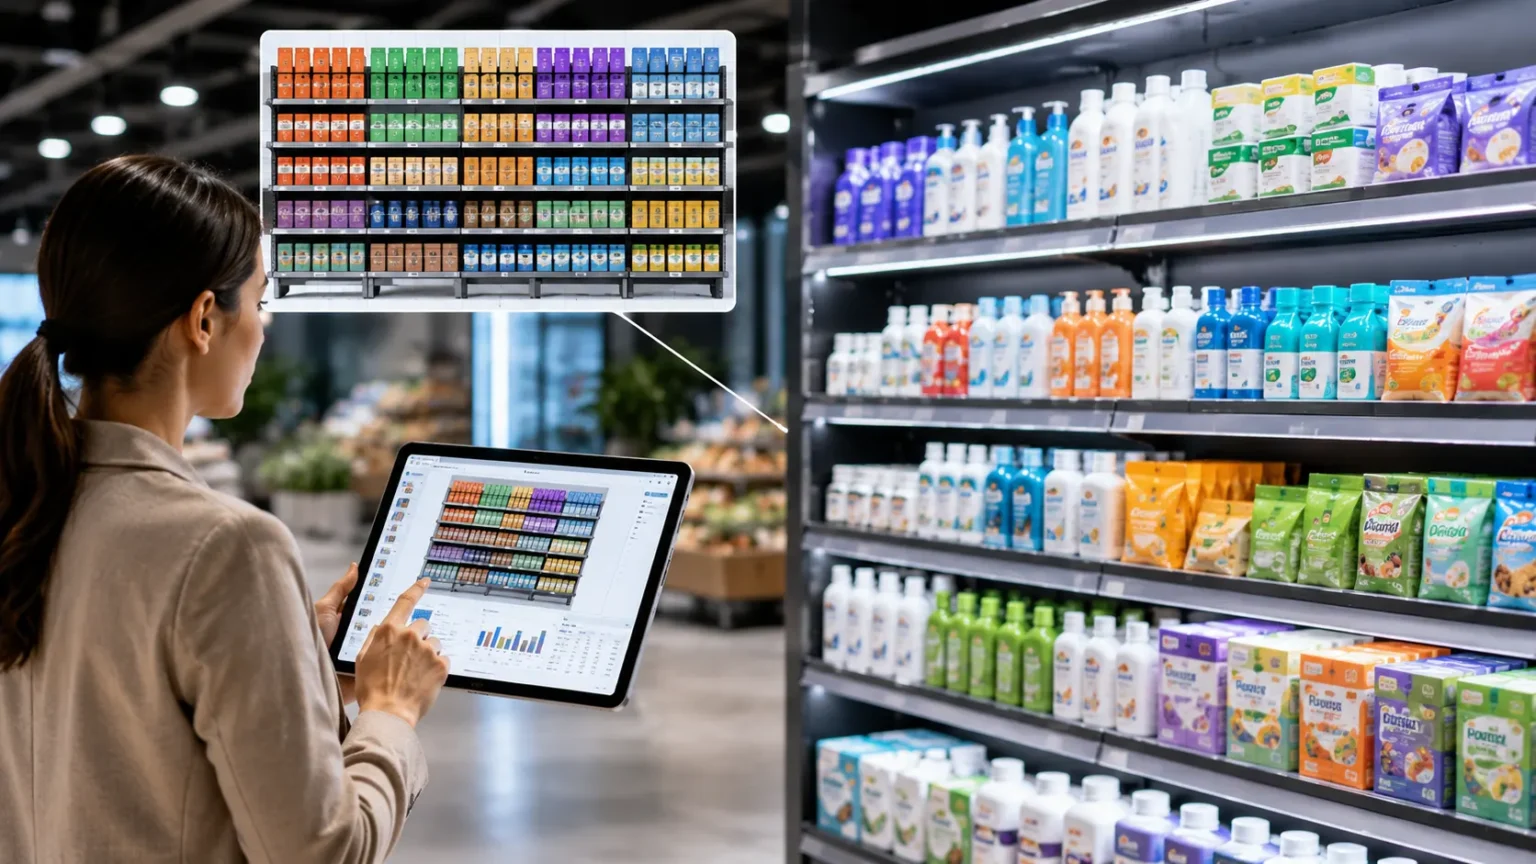
A planogram is a visual diagram that shows where and how products should be placed within a retail display, shelf, fixture, or store section. It gives store teams detailed instructions for arranging merchandise according to an agreed layout. A planogram may specify which products belong on each shelf, how many facings they should receive, their position relative to competing products, and the amount of space assigned to each SKU. Retailers commonly create these diagrams for grocery aisles, beauty displays, pharmacy shelves, beverage coolers, electronics sections, and many other environments. By turning merchandising strategy into a visual guide, a planogram helps employees reproduce the intended display accurately. It essentially acts as a blueprint for retail product placement.
The term is frequently shortened to POG within retail organizations. A planogram can range from a simple image showing product positions to a highly detailed digital layout containing exact fixture measurements, SKU dimensions, shelf heights, inventory capacity, and performance data. Large retail chains may create separate planograms for hundreds or thousands of product categories. Each store then receives the layouts that correspond to its particular size, assortment, and fixture configuration. Smaller retailers can use simplified versions created manually or through retail planning software. The level of sophistication varies considerably, but the main objective remains consistent. Planograms organize products intentionally rather than allowing shelf placement to develop randomly.
Planograms form an important part of visual merchandising and space planning. Visual merchandising focuses on presenting products in a way that attracts attention and helps shoppers navigate a store, while space planning focuses on allocating limited retail space effectively. A planogram brings these ideas together at shelf level. A retailer may decide that bestselling products deserve more facings, premium products should appear at eye level, and complementary products should sit close together. These decisions can then be translated into an exact shelf arrangement. Store employees do not have to interpret a general merchandising strategy independently because the planogram shows the intended result. This creates greater consistency between strategic planning and everyday store execution.
Retailers also use planograms to manage relationships between products. Items are rarely positioned in isolation because shoppers compare brands, package sizes, prices, and product varieties while standing in front of the shelf. A category manager may place similar products together so customers can compare them easily. Alternatively, complementary items may be positioned nearby to encourage convenient cross-shopping. Product size can also influence positioning because large packages consume more physical shelf space than smaller SKUs. Effective planogram design therefore considers both shopper behavior and practical fixture limitations. The objective is to create a layout that makes commercial sense while remaining intuitive for customers.
A planogram should not be thought of as a permanent shelf design that never changes. Retail assortments evolve as new products launch, seasonal items arrive, sales trends shift, suppliers change packaging, and underperforming products are removed. Retailers may therefore revise planograms several times throughout the year. Some high-volume categories change even more frequently in response to promotions or assortment decisions. Digital planning tools make these updates easier because teams can modify layouts centrally and distribute revised versions to stores. The ongoing nature of planogram management is important because yesterday’s ideal shelf arrangement may not reflect today’s product demand. Good retail space planning continuously adapts to changing customer behavior and business priorities.
How Does a Planogram Work?
The planogram process usually begins with understanding the retail space that must be planned. Merchandising teams collect information about the fixture, including width, height, depth, number of shelves, and any physical restrictions. They also identify which products are available for that store or category. Accurate product dimensions are important because the software or planner needs to know whether each SKU will physically fit within the assigned location. Information such as package width, height, depth, case quantity, and minimum stock levels may also be included. Once these inputs are available, the planner can begin constructing a realistic shelf layout. A planogram that ignores physical measurements may look attractive digitally but prove impossible to execute in the store.
Sales and inventory data can then help determine how much space individual products should receive. A high-volume product may need several facings because customers purchase it frequently and the shelf must hold enough inventory between replenishment cycles. A slower-selling product may receive only one facing because dedicating additional space would provide little commercial value. Retailers can compare sales per unit of shelf space to identify which products are using their allocation efficiently. Profitability, strategic importance, supplier agreements, and customer expectations may also influence these decisions. Space allocation is therefore not always based on sales alone. A well-designed planogram balances financial performance with assortment variety and the overall shopping experience.
The planner then organizes products according to category rules and merchandising objectives. Products may be grouped by brand, flavor, size, price level, customer need, product type, or another logical attribute. For example, a supermarket cereal aisle might separate children’s cereals, healthier options, family-size packages, and premium products. The exact structure depends on how customers naturally shop the category. Shelf height also matters because eye-level positions often receive more attention than very low or very high shelves. Retailers may reserve particular locations for strategic products while maintaining a logical category flow. The resulting planogram should help customers scan the display quickly without making the arrangement feel confusing or arbitrary.
After the layout has been approved, it is distributed to store teams for implementation. Employees remove or reposition merchandise so the physical shelf matches the planogram. Detailed instructions may show shelf heights, product sequence, number of facings, labels, and fixture components. Stores often receive implementation dates so new layouts are introduced consistently across the chain. During major resets, merchandising teams or third-party field representatives may help rearrange large sections. Execution quality matters because even the most sophisticated planogram creates little value if stores do not follow it. Retailers therefore increasingly use photographs, audits, mobile applications, or computer vision tools to confirm whether physical displays match approved plans.
The process continues after implementation because retailers monitor performance and adjust layouts when necessary. Sales data can reveal whether products perform better or worse after being repositioned. Out-of-stock rates may show that fast-selling items need more shelf capacity. Customer behavior may indicate that a category structure is difficult to navigate. Store feedback can also uncover practical problems that planners could not predict, such as packaging that falls over or fixtures that differ slightly from the digital specifications. These insights can inform the next version of the planogram. Effective planogramming is therefore a continuous cycle of planning, execution, measurement, and improvement rather than a single merchandising event.
Key Elements of a Retail Planogram
One of the most important elements is product position. The planogram identifies exactly where each SKU should appear within the fixture. Position may be described by shelf number, horizontal sequence, vertical level, and distance from other products. Retailers pay close attention to position because visibility can influence whether shoppers notice or consider an item. Products placed near eye level are often easier to see than merchandise near the floor. However, premium positions are limited, so retailers need clear priorities when allocating them. Customer expectations also matter because moving familiar products unexpectedly can make shopping frustrating. Good product positioning balances visibility, performance, category logic, and convenience.
Another key element is the number of facings allocated to each product. A facing refers to one visible unit of a product presented toward the shopper. If the same product appears three units wide across a shelf, it has three facings. More facings generally increase product visibility and allow the shelf to hold additional inventory. However, every extra facing consumes space that could otherwise be allocated to another SKU. Retailers therefore need to determine whether the additional visibility and capacity justify the space. Fast-selling items often receive more facings to reduce the frequency of replenishment and lower the risk of empty shelves. Planograms show these quantities precisely so stores maintain the intended allocation.
Shelf dimensions and fixture characteristics are equally important. Retail equipment varies significantly across store formats, and the same category may not fit identically in every location. A large supermarket could have a six-meter aisle section for a category while a small urban store has only half that space. Shelf depth can determine how many units fit behind the front-facing product. Adjustable shelf heights may also need to change when taller products are introduced. Planogram software can use fixture measurements to calculate whether the proposed arrangement fits physically. Accurate measurements reduce execution problems and help planners understand how much inventory each display can actually hold. Space optimization depends on working within real physical limitations.
Product grouping provides the logic that helps shoppers understand a display. Retailers may organize products vertically by brand, horizontally by category, or according to price, size, flavor, or customer need. The right strategy depends heavily on how customers approach the category. A skincare display, for example, might group products by function such as cleansers, moisturizers, and treatments rather than simply placing all products from one brand together. A beverage cooler might emphasize brand blocks because shoppers often recognize drinks visually from a distance. Planograms make these grouping rules visible and repeatable. Strong grouping helps customers find products faster while also making the overall fixture look intentional and organized.
Signage, labels, promotional elements, and secondary fixtures can also be incorporated into planogram planning. The diagram may show where shelf-edge labels belong or where promotional signs should appear during a particular campaign. Some displays include hooks, baskets, trays, branded shelving, or product dividers that affect the available space. Promotional products may receive temporary additional facings or a highlighted location. Digital planograms can account for these elements so the store knows how the complete display should look. This is especially useful during seasonal resets and promotional events involving multiple components. A successful planogram therefore represents more than product order; it can document the entire physical merchandising environment surrounding the products.
Examples of Planograms in Retail
A supermarket cereal aisle provides a straightforward planogram example. The retailer might divide the fixture into children’s cereals, family cereals, healthy options, granola, and premium varieties. Bestselling products could receive several facings because they move quickly and require more shelf capacity. Smaller brands might receive one or two facings to maintain assortment variety without taking excessive space. Family-size boxes could be positioned on shelves with sufficient height, while smaller packages fill shorter spaces efficiently. The retailer may also keep related product varieties together so customers can compare them easily. A planogram ensures that the same arrangement can be recreated across stores with similar aisle configurations.
Beauty and personal-care stores use planograms extensively because these categories contain many similar-looking SKUs. A skincare section may organize products by customer need, brand, ingredient, or routine stage. Cleansers could appear first, followed by toners, treatments, moisturizers, and sun protection. Premium products might receive stronger visual positioning, while testers or promotional signs can be incorporated into the layout. Because packages vary widely in shape and size, shelf dimensions must be planned carefully. Small products may require trays or dividers so the display remains neat. A strong beauty planogram helps shoppers navigate a complex assortment while allowing retailers to maintain a polished, premium appearance.
Convenience stores frequently use planograms for refrigerated drinks. A cooler may contain bottled water, carbonated drinks, energy beverages, juices, sports drinks, and ready-to-drink coffee. Products can be arranged in vertical brand blocks or grouped according to beverage type. High-demand individual drinks may receive multiple rows because they sell quickly during busy periods. New or promotional products may be positioned near eye level to increase visibility. Package dimensions also matter because cans, small bottles, and large bottles require different shelf heights. By planning these details in advance, retailers can maximize cooler capacity without making the selection look overcrowded. The planogram also helps employees know where each product should be replenished.
Pharmacies provide another useful example because shoppers often need to locate specific health and personal-care products quickly. A pain-relief section might be divided into tablets, capsules, topical products, children’s options, and specialized formulations. Products can then be organized by brand, ingredient, pack size, or strength depending on the retailer’s merchandising strategy. Shelf labels and category signs help customers understand the structure. High-demand products may receive additional facings, while lower-volume specialty products preserve assortment breadth. The planogram can also account for packaging differences such as small boxes, bottles, and hanging products. A logical arrangement reduces search effort and helps employees maintain a consistent display.
Electronics retailers use planograms differently because many products are displayed as demonstration units rather than rows of packaged merchandise. A laptop display, for example, might allocate spaces according to price tier, manufacturer, screen size, or customer segment. Each display position could include the demonstration device, security equipment, product information, and accessories. Smartphone sections may organize models by brand or ecosystem while maintaining standardized spacing between devices. Accessories can be positioned nearby to support complementary purchases. The planogram ensures that electrical requirements, fixture dimensions, security components, and promotional materials all fit correctly. This shows how planograms can guide complex displays as effectively as ordinary grocery shelves.
Benefits of Using Planograms
One of the strongest benefits of planograms is better use of limited retail space. Physical stores have finite shelf capacity, and every centimeter allocated to one product is unavailable to another. Planograms encourage retailers to make those decisions systematically rather than relying on guesswork. Sales performance, profitability, demand, package dimensions, and strategic importance can all influence space allocation. Fast-moving items can receive enough capacity to remain available, while slow-moving products are prevented from occupying excessive shelf space. This improves overall productivity per fixture. When hundreds or thousands of products are involved, even relatively small improvements in space utilization can have a meaningful effect on store performance.
Planograms also create consistency across multiple store locations. Without clear visual instructions, employees in different branches might arrange the same category in completely different ways. That inconsistency can make merchandising campaigns difficult to manage and create unpredictable customer experiences. A standardized planogram gives every store a common reference point. Customers who visit several locations are more likely to find familiar products in similar positions. Suppliers also benefit because agreed product placement can be implemented more consistently. Central teams can update the layout once and distribute the revision across the organization. Consistency becomes particularly important for national and international retailers managing hundreds of branches with thousands of employees.
Improved product visibility is another important advantage. Planogram designers can make deliberate decisions about which products deserve eye-level positioning, additional facings, stronger brand blocks, or placement near complementary categories. These choices can make important items easier for customers to notice. New products may need additional visibility during launch periods because customers are not yet familiar with them. Bestsellers may receive larger visual blocks because strong recognition makes the category easier to navigate. Retailers can also prevent displays from becoming visually chaotic by using consistent spacing and grouping. Better visibility does not simply mean giving every product more space. It means using available space strategically so the overall assortment becomes easier to shop.
Inventory management can also improve when shelf capacity is connected with sales demand. If a fast-selling product receives only one facing, employees may need to replenish it constantly or risk an out-of-stock situation. Providing additional facings increases the number of units that can remain available between replenishment cycles. Conversely, dedicating excessive space to a slow-moving product can create unnecessary shelf inventory and reduce room for stronger performers. Planogram systems can use sales and inventory data to estimate appropriate capacities. This connection helps merchandising and supply-chain teams work toward the same objective. A shelf layout becomes more useful when it reflects not only visual appearance but also the practical rate at which products actually sell.
Planograms can also support better decision-making by giving retailers a measurable framework for merchandising. Instead of discussing shelf placement only in subjective terms, teams can evaluate sales per facing, sales per unit of space, margin contribution, inventory turns, and availability. They can test different layouts and compare performance after changes. Retailers may discover that some products need more space while others can maintain sales with fewer facings. Category managers can use these findings to refine future resets. Data does not eliminate merchandising judgment because customer experience and strategic priorities still matter. However, it gives planners a stronger foundation for deciding how valuable retail space should be distributed.
Planogram and Visual Merchandising Best Practices
A good planogram starts with the shopper rather than the shelf. Retailers should understand how customers approach the category, what questions they are trying to answer, and how they compare products. Organizing a section according to internal company structures may be convenient for the retailer but confusing for shoppers. Category research, purchase data, customer feedback, and observational studies can reveal more natural decision paths. For example, customers may shop a food category primarily by flavor while the retailer previously organized it by manufacturer. Rebuilding the planogram around real shopping behavior can make navigation easier. Customer logic should therefore guide the overall structure before individual product positions are determined.
Retailers should also protect important visual zones without overcrowding them. Eye-level shelves attract attention, but placing too many priority products in one small area reduces the impact of all of them. Strong planograms create visual hierarchy by grouping related items and allowing customers to scan the display quickly. Brand blocking, color consistency, package shape, and product size can influence how the shelf appears from a distance. However, visual presentation should remain functional. A beautiful layout that makes common products difficult to find is not effective merchandising. The best displays combine commercial priorities with clarity. Shoppers should understand the category structure within seconds rather than studying the shelf carefully to determine where products belong.
Space should be connected with demand whenever possible. Fast-selling items need enough capacity to remain available between replenishment visits, particularly in high-traffic locations. Retailers can examine unit sales, inventory turns, and out-of-stock patterns before assigning facings. However, historical sales should not be the only consideration because new products lack established performance and strategic categories may require broader assortment. Seasonality can also change demand significantly. Sunscreen, cold beverages, holiday products, and school supplies can require temporary space adjustments during specific periods. Planogramming therefore works best when performance data is combined with merchandising judgment. Static rules cannot capture every change in customer demand.
Retailers should design planograms that store employees can execute realistically. A digital layout may look perfect but fail if it requires constant adjustment or uses shelf measurements that differ from the actual fixture. Planners should validate product dimensions, shelf capacities, and packaging stability before final approval. They should also consider how quickly employees can replenish the display during normal store operations. Products that sell rapidly should be easy to access and refill. Clear implementation instructions, shelf labels, and reference images make execution simpler. Store feedback should be encouraged because frontline employees often notice practical problems first. A planogram succeeds only when the physical store can maintain it consistently.
Regular review is another important best practice. Product launches, discontinued SKUs, package redesigns, changes in customer demand, and supplier decisions can quickly make an old planogram inaccurate. Retailers should establish review cycles appropriate to each category rather than updating everything at the same frequency. Stable categories may need relatively infrequent revisions, while seasonal or highly innovative categories require more attention. Performance data should be examined after major resets to determine whether the intended improvements actually occurred. Retailers should also monitor compliance because poor execution can make a strong plan appear ineffective. Continuous improvement helps ensure that shelf layouts evolve alongside customer behavior and assortment changes.
Planogram Software and Retail Technology
Planogram software helps retailers create digital shelf layouts more efficiently than manual drawings or spreadsheets. These platforms allow planners to build fixtures using accurate dimensions and then place digital product representations onto the shelves. Product databases may contain package measurements, images, category information, costs, prices, sales performance, and inventory attributes. Planners can move products visually while the software calculates available space and capacity. Some systems also estimate financial performance for different layouts. This allows teams to test merchandising ideas before stores spend time physically rearranging displays. Large retailers can manage extensive libraries of planograms covering thousands of stores and categories from a centralized planning environment.
Modern systems increasingly connect planogram planning with retail analytics. Sales data can show which products generate the strongest revenue or margin within a category. Inventory information can reveal whether a product frequently goes out of stock. These insights can be combined with shelf dimensions to recommend more appropriate space allocations. A product that sells rapidly but receives little space may be identified as an opportunity for additional facings. Conversely, a large shelf allocation producing weak sales may be reduced. Data-driven recommendations help planners examine more variables than they could reasonably calculate manually. Human judgment remains important because software may not fully understand brand strategy, customer expectations, or upcoming product initiatives.
Artificial intelligence and machine learning are also influencing retail space planning. Advanced systems can analyze historical sales, store characteristics, customer demand, promotions, and seasonal patterns to suggest layouts or assortment changes. Retailers may use predictive models to estimate how changing shelf space could affect product availability or sales. AI can also help identify relationships between neighboring products and category performance. However, automated recommendations need appropriate oversight because past performance does not always predict future behavior. New products, changing trends, and local preferences can challenge purely historical models. The most useful technology supports planners with additional insight while allowing experienced merchandising teams to apply business context.
Computer vision is becoming increasingly relevant to planogram compliance. Store employees or field representatives can capture shelf images using smartphones or dedicated cameras. Software can then analyze those images to determine whether products appear in the correct locations and quantities. It may identify missing items, incorrect facings, misplaced products, or empty shelf positions. Retailers can use this information to prioritize corrective work rather than relying entirely on manual audits. Automated shelf recognition can be particularly useful for chains with many locations because centralized teams cannot inspect every store frequently. The technology is still affected by factors such as poor lighting, obstructed products, and packaging changes, so human verification may remain necessary.
Cloud-based planogram platforms also make collaboration easier across merchandising, category management, store operations, suppliers, and field teams. Central planners can publish updated layouts while store employees access the latest versions through mobile devices. This reduces the risk of teams working from outdated files. Implementation status can be tracked, and stores may upload photographs after completing a reset. Suppliers can sometimes participate in collaborative planning while retailers retain final control over space decisions. Connecting planogram technology with inventory, sales, and workforce systems can further streamline execution. The overall direction of retail technology is toward more connected planning, where shelf layouts become part of a larger data-driven merchandising ecosystem.
Common Planogram Mistakes to Avoid
One common mistake is allocating shelf space based entirely on supplier pressure or historical habits. A product may have occupied a large section for years even though customer demand has changed significantly. Continuing the same allocation without reviewing performance can waste valuable retail space. Supplier relationships are important, but the retailer must still consider customer needs, sales productivity, profitability, and overall category health. Decisions should be supported by transparent merchandising principles. Regular category reviews can identify products that have become over-spaced or under-spaced. A planogram should reflect current business reality rather than simply copying the previous layout because changing it would require additional work.
Another mistake is relying only on sales data without considering the customer experience. High-selling products deserve appropriate space, but removing too much assortment variety can make the category less useful to shoppers. Some lower-volume items serve specific customer needs and help establish the retailer as a complete shopping destination. New products also need an opportunity to gain visibility before historical sales data can be meaningful. Retailers must therefore balance productivity with assortment strategy. A shelf filled only with current bestsellers may perform well temporarily but limit choice and innovation. Good planograms use data as evidence while preserving enough merchandising judgment to account for factors that raw sales numbers do not capture.
Incorrect product or fixture measurements can cause immediate execution problems. If digital product dimensions are smaller than the real packages, a planogram may assign more facings than the shelf can physically hold. Incorrect shelf heights can prevent larger products from fitting. Store teams then have to improvise, resulting in inconsistent displays across locations. Maintaining accurate dimensional data is therefore essential for reliable space planning. Retailers should update measurements when suppliers redesign packaging because even small size changes can affect crowded fixtures. Field teams should also report fixture differences when stores do not match central records. Accurate inputs are the foundation of an executable planogram.
Ignoring local store differences is another frequent mistake. A standardized national planogram can improve consistency, but not every location has identical demand. An urban convenience store, suburban supermarket, and tourist-area shop may sell very different product mixes. Climate, demographics, store size, regional tastes, and local competition can all influence demand. Retailers can address this by creating store clusters or localized planogram versions rather than designing a completely unique layout for every branch. Stores with similar characteristics can share a common assortment and space allocation. This approach preserves efficiency while recognizing meaningful differences. Excessive standardization can reduce performance when the plan does not reflect how local customers actually shop.
Failing to monitor execution can make planogram analysis misleading. Central teams may assume stores implemented the new layout correctly and then judge its success based on sales results. If products were placed incorrectly or facings were never updated, the performance data does not represent the intended test. Retailers should therefore measure planogram compliance alongside commercial results. Store photographs, field audits, mobile checklists, and computer vision can all provide evidence of execution quality. Teams should also investigate why compliance problems occur rather than simply blaming store employees. The plan itself may be difficult to understand or maintain. Strong planogram management connects design, implementation, auditing, feedback, and continuous improvement.
Why Planograms Matter in Modern Retail
Planograms matter because physical retail space remains one of a store’s most valuable resources. Online stores can display enormous product catalogs without worrying about physical shelf width, but brick-and-mortar retailers must make difficult choices about what deserves visible space. Every additional SKU or facing creates an opportunity cost somewhere else. Planograms give retailers a structured method for managing those trade-offs. They connect assortment decisions with physical reality so merchandising strategies can actually be executed. As retailers face pressure from ecommerce and changing shopping habits, making stores easier to navigate becomes even more important. Thoughtful shelf planning can help physical stores deliver the convenience and clarity customers increasingly expect.
They also matter because customers make many decisions directly in front of the shelf. Shoppers may enter a store with a general need rather than a specific brand already chosen. Product visibility, grouping, package recognition, price labels, and nearby alternatives can influence the final decision. A confusing shelf can make comparison difficult and cause customers to leave without buying the intended product. A clear planogram organizes the decision environment so customers can understand their options more easily. Retailers can also position complementary products in ways that support natural shopping missions. Although shelf placement cannot guarantee a purchase, it shapes the environment in which many purchase decisions happen.
Data has made planograms more measurable than in the past. Retailers can connect shelf layouts with point-of-sale information, inventory records, loyalty data, promotional activity, and store-level performance. This allows planners to examine whether additional facings actually improve availability or whether moving a product changes its sales. Different store clusters can also receive different layouts based on local demand. These capabilities turn space planning into a more analytical discipline while retaining the creative elements of merchandising. Retailers no longer need to rely exclusively on intuition when deciding how shelf space should be distributed. Increasingly, successful planograms combine human understanding of shoppers with quantitative evidence about product performance.
Planograms also create a bridge between central retail strategy and frontline execution. Headquarters may develop sophisticated category strategies, but those ideas deliver no value until shelves inside actual stores reflect them. Planograms convert abstract goals into practical instructions that employees can follow. They show which products belong where, how many facings are required, and what the finished display should look like. Digital tools can make this communication faster and provide evidence when implementation is complete. This alignment becomes especially important for large chains where thousands of employees may participate in merchandising resets. A clear visual standard reduces interpretation and helps stores execute strategic decisions more consistently.
Ultimately, a planogram is much more than a picture of a shelf. It represents a set of decisions about customers, assortment, space, inventory, merchandising, and business performance. The strongest planograms make products easier to find while allocating sufficient space to items that need it. They also remain practical enough for store teams to maintain during everyday operations. As retail technology advances, planograms are becoming increasingly connected with artificial intelligence, analytics, inventory systems, and automated shelf monitoring. However, the central principle remains simple: put the right products in the right places with the right amount of space. When retailers achieve that consistently, both customers and store operations can benefit.
Frequently Asked Questions About Planograms
What is a planogram in simple terms?
A planogram is a visual guide showing where products should be placed on retail shelves or displays. It helps store employees arrange merchandise consistently and gives each product an intended amount of space.
What is an example of a planogram?
A supermarket diagram showing exactly where every cereal box should appear, how many facings each product receives, and which shelf it belongs on is a planogram. Similar layouts are used for beverages, cosmetics, pharmacy products, electronics, and many other categories.
What does POG mean in retail?
POG is a common abbreviation for planogram in the retail industry. Employees may use phrases such as “POG reset” or “POG compliance” when discussing shelf layouts and merchandising execution.
What is a facing in a planogram?
A facing is one visible product unit positioned toward the customer at the front of a shelf. If the same product appears four units wide, it generally has four facings.
Why do retailers use planograms?
Retailers use planograms to improve product placement, use shelf space efficiently, maintain consistency, support inventory availability, and make categories easier for customers to shop. They can also help retailers measure the commercial productivity of different shelf allocations.
Who creates planograms?
Planograms may be created by space planners, visual merchandisers, category managers, retail analysts, or merchandising teams. Suppliers may provide input, but retailers typically determine how their store space is ultimately allocated.